(Lei Ruibo, Xiangshan Tian-Kunze, Bingrui Li, Petra Heil, Jia Wang, Junbao Zeng, Zhongxiang Tian, 2017.Characterization of summer Arctic sea ice morphology in the 135°-175°W sector using multi-scale methods, Cold Regions Science and Technology, Cold Regions Science and Technology, 133, 108–120.)
In summer 2014, sea ice morphological characteristics were investigated in the 135°–175°W sector of the Arctic Ocean using in situ, shipborne, and remote sensing measurements. Sea ice in this sector was deformed and compact compared to previous observations. The average ice area in the region (70°–82.5°N, 135°–175°W) was 7.6 × 10⁵ km2 for 29 July through 6 September 2014, the fourth largest record between 2003 and 2014. This can be attributed to the enhanced multiyear sea ice inflow from north of the Canadian Arctic Archipelago from September 2013 to August 2014. Multiyear ice coverage in the study region on 30 April 2014 was 55%, which was larger than the values in 2005–2013. During the melt season of 2014, the Arctic Dipole had a positive anomaly, associated with enhanced southerly wind. In summer 2014 the marginal ice zone exhibited a distinct ice retreat, whereas the pack ice zone (PIZ) showed strong persistence due to the large coverage of multiyear ice. The northward retreat of the PIZ boundary was b100 km from late July through early September 2014. In the PIZ of 76–80.5°N, average ice thickness
weighted by ice concentration, obtained by shipborne measurements in August 2014 was 0.54m thicker than that obtained in August 2010 due to enhanced ice deformation and less open waters in 2014. At 81°N, sea ice with modal thickness of 1.48 m reached thermodynamic balance by late August 2014, which was much earlier than that in 2010.
Fig. 1. (a) Average sea ice concentration derived from AMSR2 data, from 29 July to 6 September 2014, with the trajectory of the Xuelong (green) and its turning points (black dots, A–L), locations of short-term station (SS, purple square) and long-term station (LS, yellow line), southern boundary of the marginal ice zone (red), and pack ice zone (blue). (b) Optical imagery from MODIS on 14 August 2014, with the ship trajectory on 14 (red) and 15 (green) August, plus locations of SS 4, SS 5, and LS. (For interpretation of the references to colour in this figure legend, the reader is referred to the web version of this article.)
(Lei Ruibo, X. Tian-Kunze, M. Leppäranta, J. Wang, L. Kaleschke, and Z. Zhang, 2016a. Changes in summer sea ice, albedo, and portioning of surface solar radiation in the Pacific sector of Arctic Ocean
during 1982–2009, J. Geophys. Res. Oceans, 121, 5470–5486, doi:10.1002/2016JC011831.)
SSM/I sea ice concentration and CLARA black-sky composite albedo were used to estimate sea ice albedo in the region 708N–828N, 1308W–1808W. The long-term trends and seasonal evolutions of ice concentration, composite albedo, and ice albedo were then obtained. In July–August 1982–2009, the linear trend of the composite albedo and the ice albedo was 20.069 and 20.046 units per decade, respectively. During 1 June to 19 August, melting of sea ice resulted in an increase of solar heat input to the ice-ocean system by 282 MJ_m22 from 1982 to 2009. However, because of the counter-balancing effects of the loss of sea ice area and the enhanced ice surface melting, the trend of solar heat input to the ice was insignificant. The summer evolution of ice albedo matched the ice surface melting and ponding well at basin scale. The ice albedo showed a large difference between the multiyear and first-year ice because the latter melted completely by the end of a melt season. At the SHEBA geolocations, a distinct change in the ice albedo has occurred since 2007, because most of the multiyear ice has been replaced by first-year ice. A positive polarity in the Arctic Dipole Anomaly could be partly responsible for the rapid loss of summer ice within the study region in the recent years by bringing warmer air masses from the south and advecting more ice toward the north. Both these effects would enhance ice-albedo feedback.
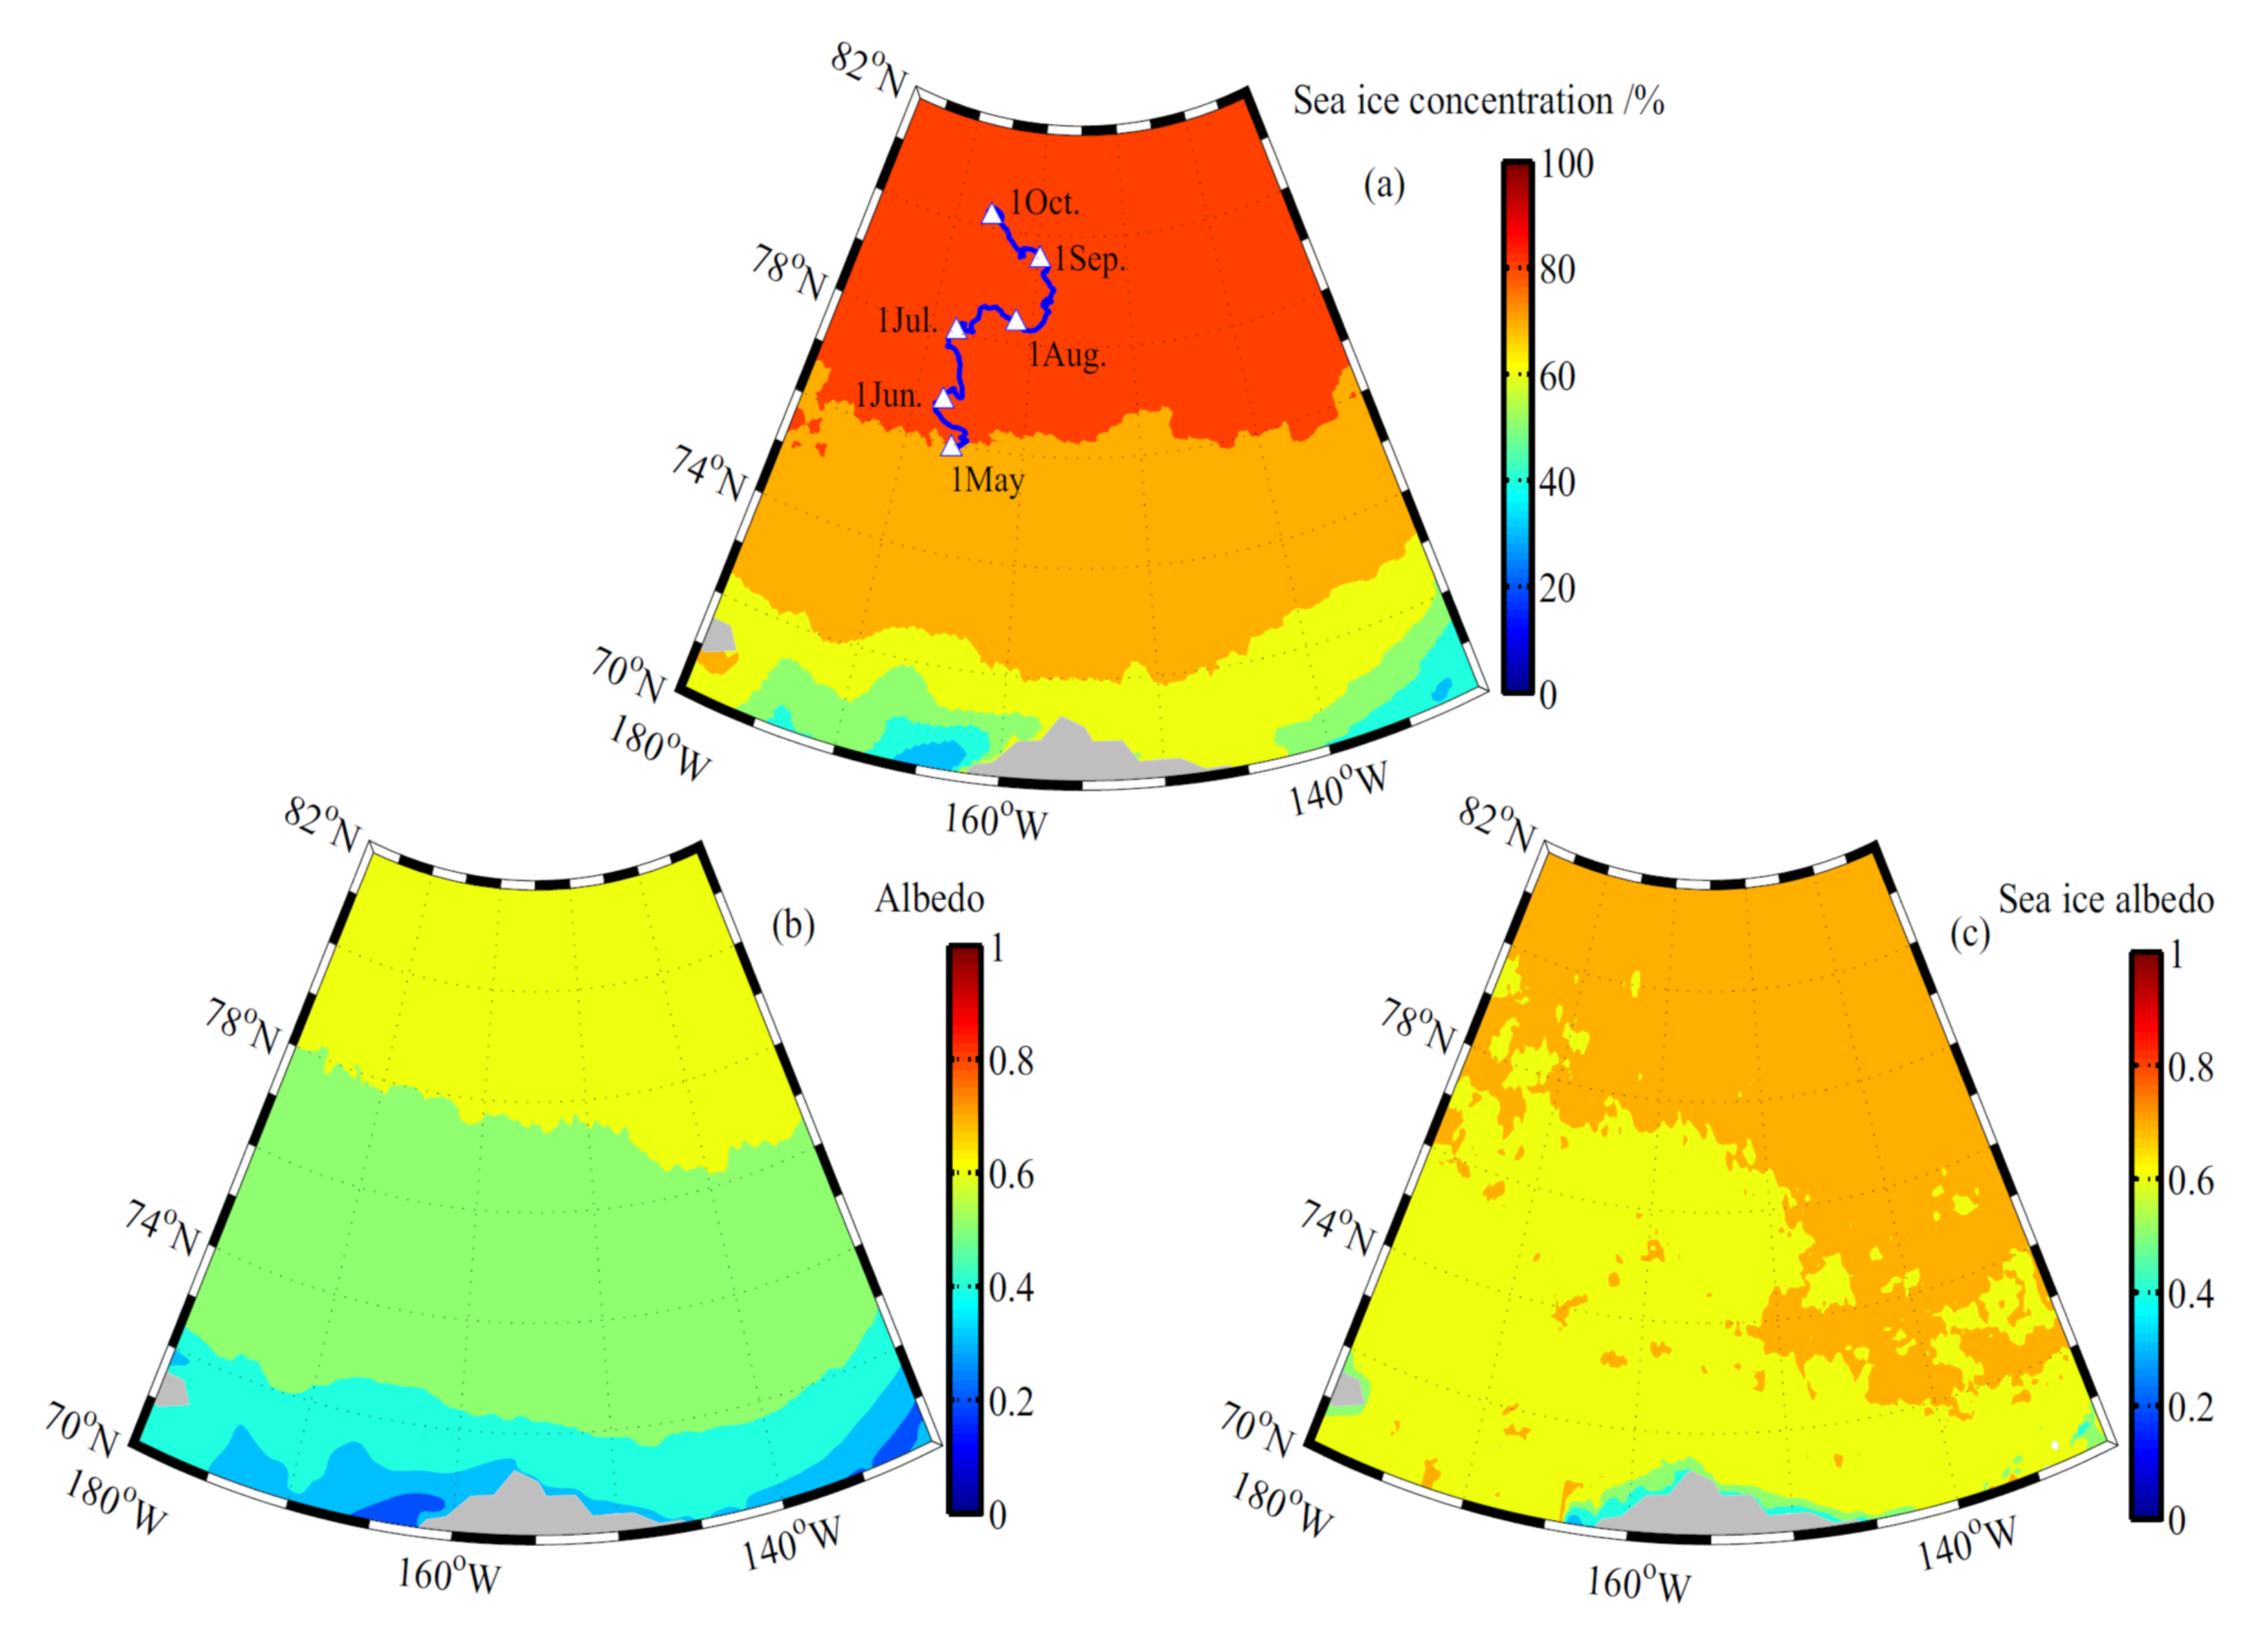
Figure 1. Climatological averages of (a) sea ice concentration, (b) composite albedo, and (c) sea ice albedo from
1 May to 19 August 1982–2009. Also shown is the track of the SHEBA campaign (blue line in Figure 1a).
© 2014 Mokaine. All Rights Reserved.More Templates - Collect from
Lorem ipsum dolor sit amet, consectetur adipisicing elit, sed do eiusmod.